Optimizing histogram in HIP#
Histogram is an operation that counts how often each value (or range of values) appears in an input dataset. It appears throughout GPU workloads, including image processing, radix sort, database operations, and machine learning. The challenge on GPUs is that the output location of each write is determined by the input value at runtime, meaning multiple threads can attempt to update the same output bin simultaneously. Efficiently managing this concurrent access is the central optimization problem.
This tutorial walks through a series of HIP kernels for computing a 256-bin histogram over a large array of unsigned integers. Starting from a naive kernel that issues one global atomic per input element, each step reduces global atomic traffic: first by moving accumulation into shared memory, then by having each thread process more elements so fewer blocks are launched. The final approach eliminates global atomics at the merge step entirely by having each block write its local histogram to a private slice of a temporary buffer, then summing those slices in a separate reduction kernel.
The complete source file for all kernels is available at:
Note
All kernels compute a 256-bin histogram over a large array of unsigned
integers and are validated against a sequential reference implementation.
They compile with amdclang++ -O3 -std=c++17 and run on any
ROCm-supported GPU architecture.
Prerequisites#
Before starting this tutorial, ensure the following are in place.
ROCm installed and
amdclang++available onPATH.Familiarity with the HIP execution model (grids, blocks, wavefronts) and its mapping to AMD GPU hardware (dispatches, workgroups, wavefronts).
Application tracing and profiling using rocprofv3 installed for performance analysis.
Histogram fundamentals#
A histogram maps each element of an input array to one of num_bins output
counters, called bins, and increments that counter. Formally, for an input
sequence \(x_1, \ldots, x_N\) and a bin mapping function \(f\), the
count for bin \(b\) is:
where \(\delta( )\) is 1 when its argument is zero and 0 otherwise. For a simple integer input, \(f(x_i) = x_i \bmod B\) maps each value to one of \(B\) bins by remainder.
The algorithm consists of three steps:
Read each input element.
Determine its bin.
Increment that bin’s counter.
On a CPU, this is straightforward. On a GPU, thousands of threads execute these steps simultaneously, and many might land in the same bin at the same time.
Race conditions#
A race condition occurs when two or more threads concurrently attempt to read-modify-write
the same memory location. Consider two threads that both want to
increment histogram[bin]:
histogram[bin] = histogram[bin] + 1;
If both threads read the value before either writes back, they both compute the same result, and the second write overwrites the first, so one increment is lost. This is a natural consequence of parallel execution: with many threads running concurrently across compute units, some will read the same value before any of them writes back.
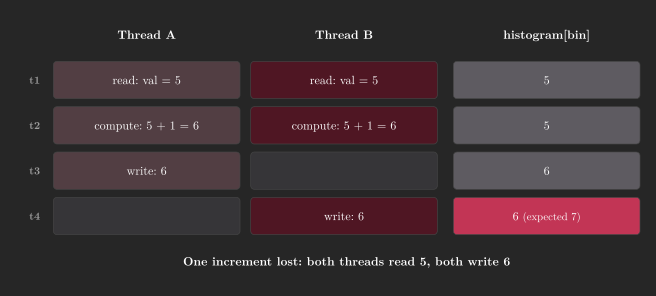
When multiple threads map to the same bin, this kind of overlap is expected. Atomic operations, covered in the next section, are the standard solution.
Atomic operations#
An atomic operation executes a read-modify-write sequence as an indivisible unit. No other thread can observe a partially completed operation or interleave its own update between the read and write. From the hardware’s perspective, the memory arbitration unit locks the relevant cache line, performs the update, and releases the lock. All competing threads observe results as if the operations occurred in a single sequential order.
HIP provides a set of atomic primitives for both global and shared memory:
Operation |
Description |
|---|---|
|
Adds a value to a memory location and returns the old value. |
|
Subtracts a value from a memory location and returns the old value. |
|
Exchanges a register value with a memory location. |
|
Compares a memory location to an expected value and, if equal, replaces it with a new value. The fundamental building block for custom atomic operations. |
|
Updates a memory location to the maximum or minimum of its current value and a given value. |
|
Atomically increments or decrements a counter, wrapping at a boundary. |
Atomic operations can target shared memory (block scope), global memory (device scope), or system memory, depending on hardware support. For more information, see the GPU atomics operations reference.
Compile and run:
amdclang++ -O3 -std=c++17 histogram.hip -o histogram
./histogram
Profile wall-clock time with rocprofv3:
rocprofv3 --kernel-trace --output-format csv -- ./histogram
The --kernel-trace CSV reports End_Timestamp - Start_Timestamp (both in
nanoseconds) for each kernel dispatch. Compare the duration column across
kernel variants to measure the impact of each optimization step.
Naive kernel#
The naive kernel issues one global atomicAdd per thread:
1__global__ void histogram_naive(const unsigned int *input, unsigned int *histogram, int n)
2{
3    int gid = blockIdx.x * blockDim.x + threadIdx.x;
4    if (gid < n)
5    {
6        unsigned int bin = input[gid] % num_bins;
7        atomicAdd(&histogram[bin], 1u);
8    }
9}
Global memory atomics must traverse the full memory hierarchy. When many threads target the same bin, the hardware serializes their updates. That is, only one can proceed at a time while the others stall. This is called atomic contention, and it limits throughput in proportion to the number of threads competing for the same address.
Two factors make contention worse in practice:
Hot bins: When the input distribution is skewed, a small number of bins receive a disproportionate share of increments. Every thread targeting a hot bin serializes against every other thread.
Wavefront serialization: Within a wavefront, if multiple lanes map to the same bin, the hardware issues their atomic operations one at a time, stalling the whole wavefront until each completes.
The example code uses a skewed input where every fourth element is fixed to bin 1, to reflect a realistic distribution in which one bin is significantly busier than the others.
What to observe#
Profile the naive kernel and record the following counter.
Counter |
What to look for |
|---|---|
Kernel duration (kernel-trace CSV) |
|
Shared memory histogram#
Atomic operations in shared memory (the Local Data Share, or LDS, on AMD GPUs) are an order of magnitude faster than global memory atomics because the LDS is on-chip and directly connected to the compute units. The shared memory kernel reduces global atomic traffic in two independent ways: moving accumulation into LDS, and having each thread process multiple elements so fewer blocks are launched overall.
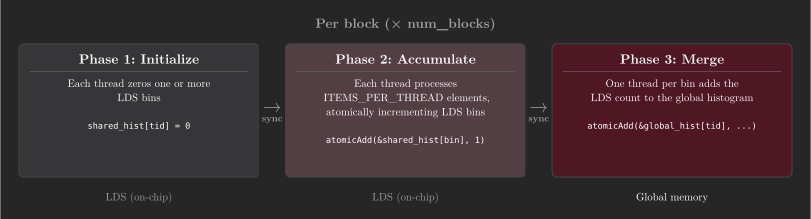
The kernel has three phases:
Initialize the per-block histogram in LDS to zero.
Each thread processes
ITEMS_PER_THREADinput elements (default: 16), atomically incrementing the appropriate LDS bin for each.One thread per bin merges the LDS histogram into the global histogram with a single global atomic.
 1__global__ void histogram_shared(const unsigned int *input,
 2                                 unsigned int *histogram,
 3                                 int n)
 4{
 5    __shared__ unsigned int shared_hist[num_bins];
 6
 7    int tid = threadIdx.x;
 8    int base = (blockIdx.x * blockDim.x * ITEMS_PER_THREAD) + tid;
 9
10    // 1. Initialize shared histogram
11    for (int i = tid; i < num_bins; i += blockDim.x)
12    {
13        shared_hist[i] = 0;
14    }
15    __syncthreads();
16
17    // 2. Process multiple items per thread (grid-stride style)
18    #pragma unroll
19    for (int i = 0; i < ITEMS_PER_THREAD; i++)
20    {
21        int idx = base + i * blockDim.x;
22
23        if (idx < n)
24        {
25            unsigned int bin = input[idx] % num_bins;
26            atomicAdd(&shared_hist[bin], 1u);
27        }
28    }
29
30    __syncthreads();
31
32    // 3. Merge into global histogram
33    for (int i = tid; i < num_bins; i += blockDim.x)
34    {
35        atomicAdd(&histogram[i], shared_hist[i]);
36    }
37}
The inner loop uses the stride i * blockDim.x, so consecutive threads in a
wavefront always read consecutive memory addresses in each iteration, so the access
pattern remains coalesced throughout. Because ITEMS_PER_THREAD is a
compile-time constant, #pragma unroll allows the compiler to eliminate the
loop counter and branch overhead.
With block_size = 256 and ITEMS_PER_THREAD = 16, each block covers
4,096 input elements. For a 16 M-element input, this launches 4,096 blocks,
compared to 65,536 for the naive kernel. The global merge step issues at most
num_bins atomics per block: 256 per block × 4,096 blocks = ~1 M global
atomics total, versus 16 M for the naive kernel.
Note
The LDS histogram occupies num_bins * sizeof(unsigned int) bytes. For
256 bins, this is 1 KB, well within the 64 KB of LDS available per Compute
Unit on CDNA GPUs and per Work Group Processor on RDNA GPUs.
What to observe#
Compare the following counter against the naive kernel baseline.
Counter |
What to look for |
|---|---|
Kernel duration (kernel-trace CSV) |
|
Partial histograms#
The shared memory kernel still issues up to num_bins global atomics per
block during the merge phase. For 4,096 blocks and 256 bins, that is roughly
one million global atomic operations.
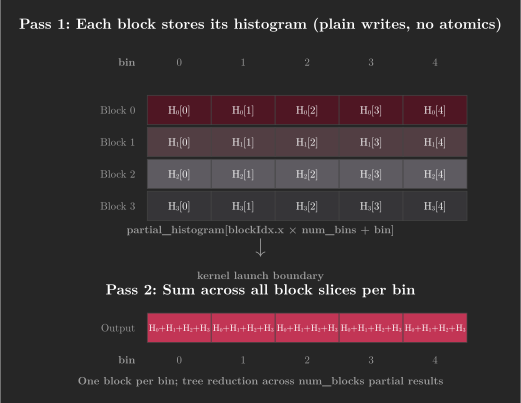
A partial histogram avoids this by deferring the merge entirely. Instead of
each block atomically adding its local counts into a single shared output array,
each block writes its num_bins counts to its own reserved slice of a
temporary partial_histogram buffer - using plain stores, with no
contention. The global output is then computed in a second kernel that sums
across all the per-block slices for each bin. Because the two passes are
separated, neither requires global atomics: the first pass uses conflict-free
stores, and the second pass is a straightforward parallel reduction (see
Optimizing reduction in HIP).
The first kernel is identical to the shared memory kernel except for the merge step, which becomes a plain store rather than a global atomic:
 1__global__ void histogram_partial(const unsigned int *input,
 2                                  unsigned int *partial_histogram,
 3                                  int n)
 4{
 5    __shared__ unsigned int shared_hist[num_bins];
 6
 7    int tid  = threadIdx.x;
 8    int base = (blockIdx.x * blockDim.x * ITEMS_PER_THREAD) + tid;
 9
10    for (int i = tid; i < num_bins; i += blockDim.x)
11    {
12        shared_hist[i] = 0;
13    }
14    __syncthreads();
15
16    #pragma unroll
17    for (int i = 0; i < ITEMS_PER_THREAD; i++)
18    {
19        int idx = base + i * blockDim.x;
20        if (idx < n)
21        {
22            unsigned int bin = input[idx] % num_bins;
23            atomicAdd(&shared_hist[bin], 1u);
24        }
25    }
26    __syncthreads();
27
28    unsigned int *block_hist = partial_histogram + blockIdx.x * num_bins;
29    for (int i = tid; i < num_bins; i += blockDim.x)
30    {
31        block_hist[i] = shared_hist[i];
32    }
33}
The partial_histogram array has num_blocks * num_bins elements, laid
out as partial_histogram[blockIdx.x * num_bins + bin]. Writing a full row
of num_bins consecutive values per block keeps the stores coalesced.
The second kernel assigns one block to each bin. Threads within each block accumulate their share of the partial results with a stride loop, then reduce to a single bin count using a shared memory tree reduction:
 1__global__ void histogram_reduce(const unsigned int *partial_histogram,
 2                                 unsigned int *histogram,
 3                                 int num_partial)
 4{
 5    int bin = blockIdx.x;
 6    int tid = threadIdx.x;
 7
 8    if (bin >= num_bins)
 9        return;
10
11    unsigned int sum = 0;
12
13    // Each thread accumulates a chunk
14    for (int i = tid; i < num_partial; i += blockDim.x)
15    {
16        sum += partial_histogram[i * num_bins + bin];
17    }
18
19    // Shared memory reduction
20    __shared__ unsigned int sdata[block_size];
21    sdata[tid] = sum;
22    __syncthreads();
23
24    // Tree reduction
25    for (int s = blockDim.x / 2; s > 0; s >>= 1)
26    {
27        if (tid < s)
28            sdata[tid] += sdata[tid + s];
29        __syncthreads();
30    }
31
32    // Write result
33    if (tid == 0)
34        histogram[bin] = sdata[0];
35}
The kernel launches a number of blocks equal to num_bins, with each block
consisting of block_size threads. Every thread accumulates data from every
blockDim.x-th partial block into a register accumulator. It then writes the
result to shared memory and participates in the tree reduction process. The
access pattern partial_histogram[i * num_bins + bin] strides by num_bins
between iterations, so consecutive threads in a wavefront read consecutive addresses
so the reads are coalesced.
Note
The partial_histogram buffer requires num_blocks * num_bins *
sizeof(unsigned int) bytes of device memory. With ITEMS_PER_THREAD =
16, block_size = 256, and a 16 M-element input, this is 4,096 blocks
× 256 bins × 4 bytes = 4 MB.
What to observe#
Compare the following counters against the shared memory kernel.
Counter |
What to look for |
|---|---|
Kernel duration (kernel-trace CSV) |
Compare |
|
From |
Tip
Increasing ITEMS_PER_THREAD reduces the block count, which reduces
merge overhead in all variants. Performance improves until the kernel
becomes compute-bound within each block and the benefit plateaus. Use
rocprofv3 --kernel-trace to find the crossover point for your target
GPU.
Further reading#
The following resources provide deeper coverage of the tools and hardware referenced in this tutorial.
rocPRIM - production-quality histogram primitives that handle edge cases and automatically apply architecture-specific tuning.
rocprofv3 documentation - detailed guide to timeline and counter profiling.
AMD GPU architecture guides (ISA references) - VGPR budgets, LDS bank geometry, and wavefront scheduling details for each architecture family.